EVALUATING THE HOUSING MARKET TOWARD THE END OF 2023
The housing market is still working toward stabilization as we get farther removed from the pandemic. In many ways, 2023 has been better for the market than many expected, but challenges still remain as we head toward 2024.
Mortgage rates have been going up since last year. In the October Market Intelligence webinar, Ali Wolf, Zonda’s Chief Economist, says this is because of Federal Reserve rate increases, inflation, and dysfunction in the mortgage-backed securities market. For most of this year, rates had stabilized in between 6%-7%, but over the last couple of months, rates have moved up over 7%, even hitting 8%.
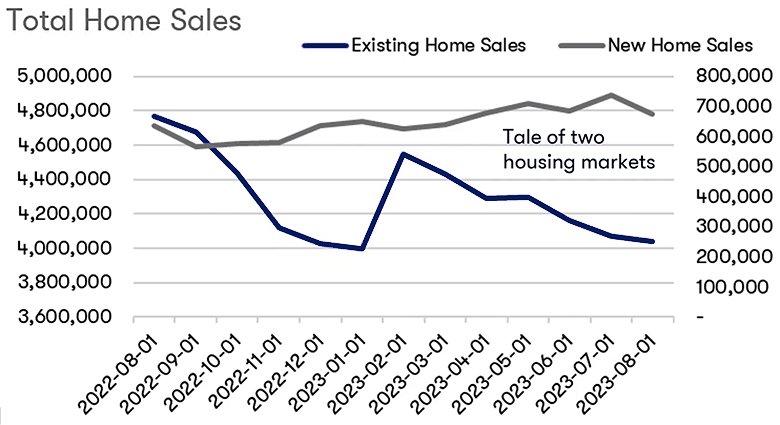
Affordability challenges, consumer confidence, and lack of supply have all played a role in recent home sales. In the chart below, the purple line for existing home sales belongs with the axis on the left. The line for new home sales goes with the axis on the right. The good news for builders is that new homes have constituted more than their usual share of sales.
RESALE SUPPLY AND NEW HOMES
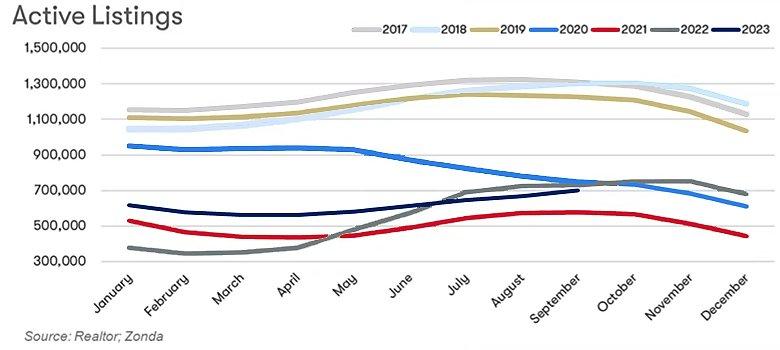
In the chart below, the line that stops in September is the year to date, and you can see it’s well below the number of active listings in 2019, before the pandemic. But it’s showing normal seasonality, which Wolf believes is a good sign that we may be returning to a normal housing market.
Working in builders’ favor is the low resale supply, which also tends to be old and expensive. In response, builders have been offering QMI (quick move-in) inventory, which is like a resale home in that buyers can move in within 90 days, but it’s brand new. They’re also offering to-be-built homes, which have become more attractive to some buyers who have to justify paying today’s high prices. New homes have always been a luxury product, but given the current high prices in the resale market, the price of a new home is now easier to justify for some consumers — given that they can customize it, pick their own finishes, and so on. And new homes become even more compelling when combined with incentives.
BUILDERS’ INCENTIVES
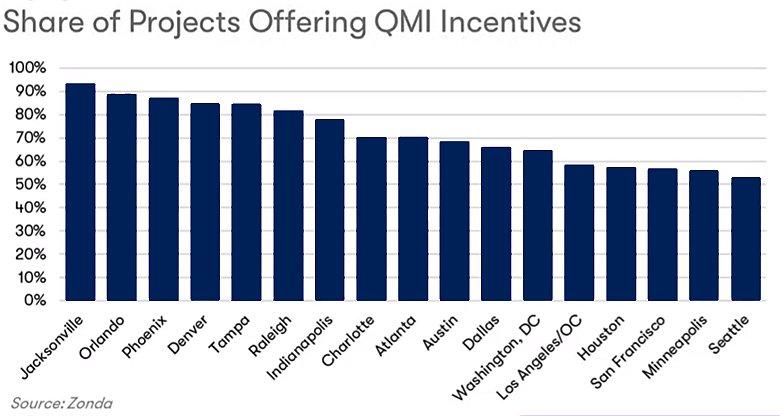
Wolf says that incentives are a big part of today’s housing market and they’re the “key to help seal the deal.” The percentage of projects offering QMI incentives varies by market from about 90% of projects in Jacksonville, Florida to about 50% in Seattle, Washington. The most effective incentives have been mortgage rate buydowns and funds towards closing costs.
Some of the larger builders have even managed to offer a 30 year fixed rate mortgage below 5%, although over 5% is more common. This is obviously helpful for buyers who are sensitive to monthly mortgage payment costs. For those who can perhaps manage the monthly payments but are tight on cash for a large down payment, funds towards closing costs will be enticing.
AFFORDABILITY CHALLENGES
Although the new home market has been outperforming expectations, it’s not “immune to the headwinds,” as Wolf puts it. Consumers are affected by headlines declaring that rates are the highest since late 2000 and that home prices are unaffordable in 99% of US counties.
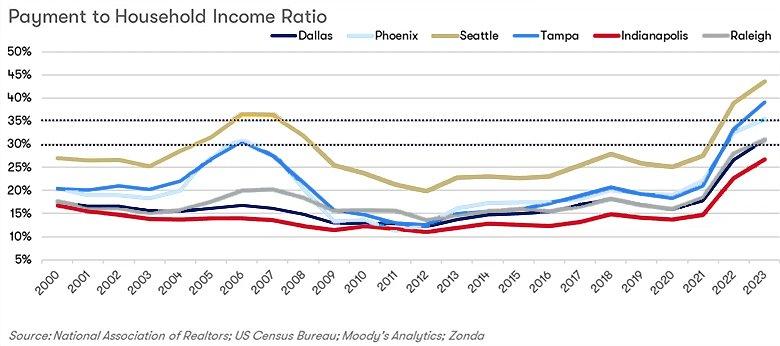
Wolf says that, generally speaking, a monthly payment to household income ratio of 30% should be the high level. 35% is stretching the budget. But more markets are getting into that stretch limit, or even higher.
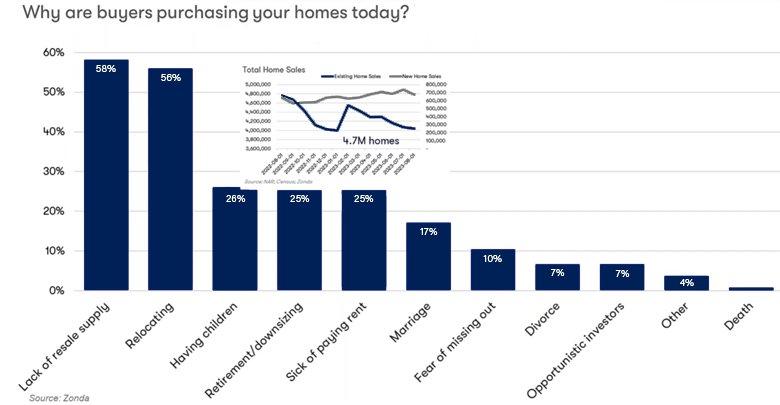
Given these affordability challenges and current high interest rates, why are consumers still buying homes — to the tune of 4.7 million homes this year?
The number one reason people are buying new homes is the lack of resale supply. But other major reasons people are buying fall into the “life happens” category — they’re relocating, having children, retiring, getting married or divorced. So even though people may not want to reset a 4% mortgage for an 8% one, life circumstances can make that into a reasonable choice.
RESPONSES TO HIGH HOUSING COSTS
There are a number of possible responses to higher housing costs. They might move back in with their parents, or get a roommate to share the costs. They might continue to rent or stay in the house they currently own, even if it’s not ideal. They might consider remodeling or buying a smaller home. They might look into different loan options and builders’ incentives. Relocation to a more affordable area of the country is another possibility.
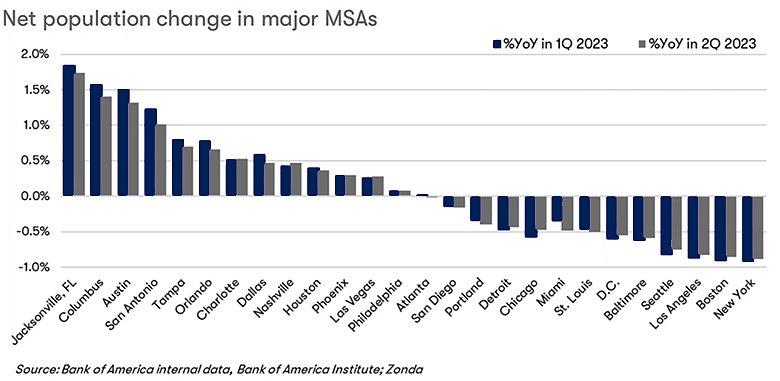
On the right in the table below are cities that have had more people leaving than moving in. It includes a number of large, expensive cities such as New York and Seattle. On the left are cities that have had YOY population growth in 2022 and 2023. It’s concentrated in the Southeast and Southwest — where there’s also been some of the higher job force growth too.
THE ‘STOP-AND-GO’ HOUSING MARKET
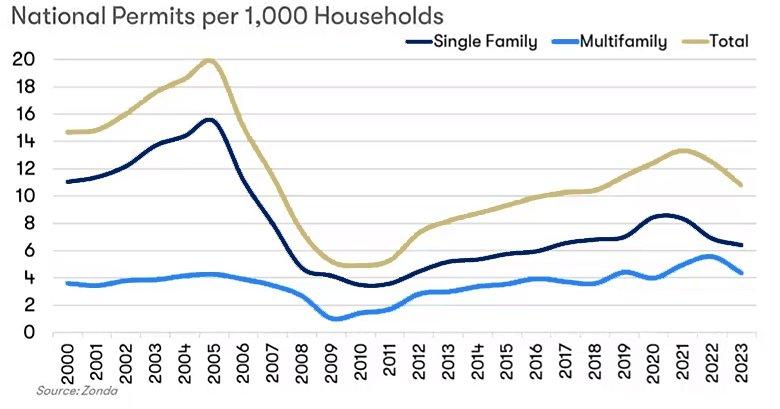
Wolf emphasizes that more building could help with affordability. Before the pandemic, the rate of permits being issued had been steadily increasing since the Great Recession, although there was still an undersupply in the market, but that activity has recently declined with the increase in interest rates.
The stop-and-go nature of the market is illustrated by comparing housing starts for the YOY for the second quarter of 2023 with the quarter-over-quarter figures. As can be seen on the right of the image above, YOY, starts in most markets have declined by single or double percentage points, including -36% in San Antonio and -31% in both Austin and Phoenix. However, when comparing the second quarter starts to those in the first quarter, there’s been double or even triple digit percentage growth, including 157% in Portland and 114% in Riverside.
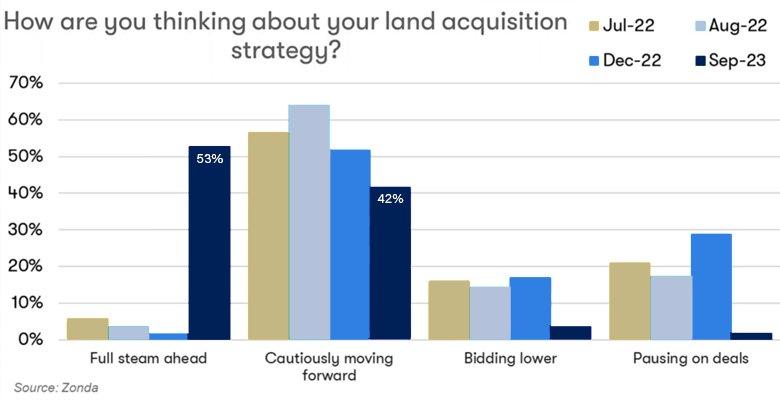
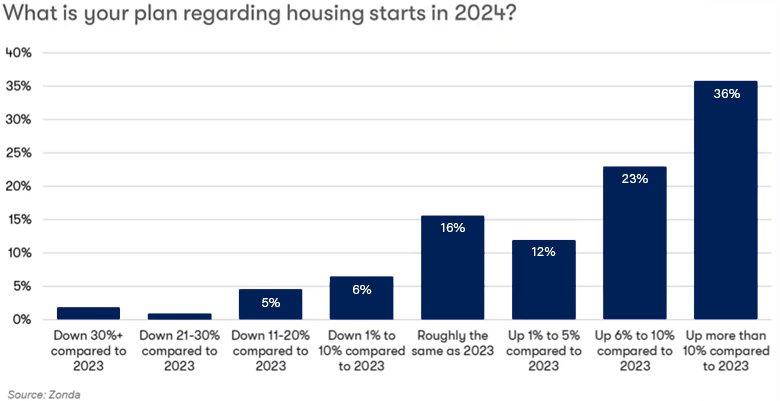
Wolf says this stop-and-go nature of the market is making it hard to catch up on inventory. However, there’s still plenty of enthusiasm regarding land acquisition, with 53% of builders “full steam ahead” in September of this year.
Furthermore, 70% of builders — at least of large, public builders that tend to be more represented in Zonda’s surveys — expect starts to increase in 2024. BTIG’s survey of smaller builders found that 40% are planning to start more homes in 2024. Wolf expects the truth is somewhere between the two. The key thing is that there is enthusiasm to build — assuming that financing remains reasonable (for both builders and consumers) and that demand holds up. A couple of potential risks to those two factors include Federal Reserve policy and the end of student loan forbearance.
BACK TO BASICS
However, while we’re considering the risks, Wolf reminds us of the importance of also thinking about the basics when considering the long-term future. And one of the fundamental factors is employment. In the table below, the section on the left shows the cities with the most overall employment growth between 2010 and 2022. The center section shows the cities with the most high-income employment growth. And the section on the right shows which cities have the highest share of high income jobs in 2022.
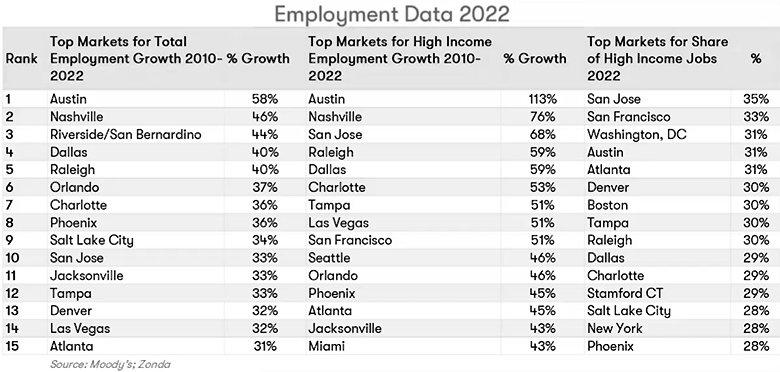
As Wolf puts it, “Going back to those basics - understanding them, digging into the data, and finding the patterns - is the best key to success in good times and in bad.”